


Stream ecology is the study of stream ecosystems and how the stream is affecting the vegetation and animals around and in it. It is similar to geomorphology but is more specific into streams and wetlands. To add on, geomorphology focuses solely on the physical structure of land, while stream ecology can also mean what is inside the stream and the substrate.
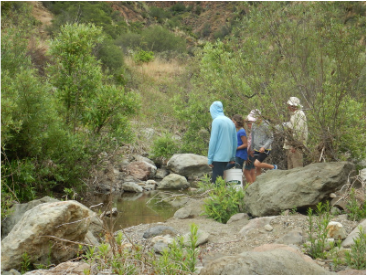
As the Stream Ecology group, we decided to test all the components of a healthy ecosystem on the 2 streams at Santa Cruz Island. To add on, since we were doing an abundance of research on Macroinvertebrates⋆ in class, and had learned that scientists normally check the water quality by looking at all the macroinvertebrates.∗ They find a spot in the stream, and see if there are only macroinvertebrates tolerant to pollution or non-tolerant they know the water quality. We decided to test both water testing methods, science lab kit and macroinvertebrate.
∗Macroinvertebrates are insects and worms that are small, yet large enough for the naked eye to see. Animals in this category include dragonflies, midges, caddisflies and mayflies.

This is a mayfly adult.
Here are two charts showing the different kinds of results possible for Water Testing Experiments:
| Tests | Stream #1 Results | Stream #2 Results |
|---|---|---|
| Lab Kit: Coliform Test | Positive - Bad | Positive - Bad |
| Lab Kit: pH Test | 6.5-Good | 7 neutral |
| Lab Kit: Dissolved Oxygen Test | 0ppm-Very bad | 0ppm-Very Bad |
| Lab Kit: Nitrate | Did not do test | 5ppm-Low |
| Lab Kit: Turbidity | N/A | Low-clear and good |
| Macroinvertabrate Method | Good | Good |
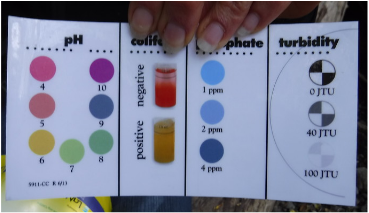
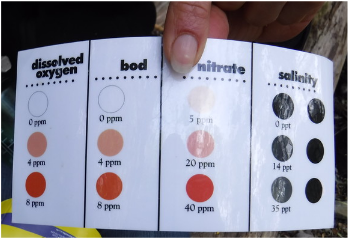
•pH: Potential of hydrogen is the “measure of acidity or alkalinity in a solution,” according to Business Dictionary.com. The numbers can rate from 1 to 14 but perfect pH is right in the center, 7.
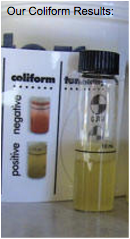
• Coliform: Coliform is a bacteria that comes from human and animal waste. This waste goes to the stream and turns into a bacteria. You would want Negative results.
• Dissolved Oxygen: Dissolved Oxygen is the amount of oxygen in the water. It is measured in either, Parts Per Million or Milligrams Per Liter. You don’t want less than 0.2 milligrams Per Liter of dissolved oxygen because then animals cannot survive. An example of something that creates oxygen is algae. Algae can release oxygen into the water during photosynthesis.
• Nitrate: Ester or salt of nitric acid. Nitrate can be used as a fertilizer and enriches soil. You want at least 10 ppm(Parts Per Million) to drink the water and for it to be safe.
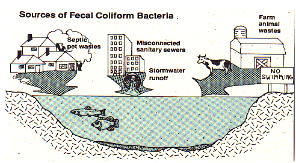
Our test results from both streams turned out positive which means there is coliform bacteria in the water. The question we had is, how did the bacteria get into the stream? Before revising the test results, we expected the coliform to be negative (good) because there aren’t many ways that coliform bacteria could have gotten on the island. We think the coliform is coming from humans, and animals. According to Santa Cruz Island History and Culture in 1864 about 24,000 sheep grazed the hills of Santa Cruz Island. We think that the waste from the animals were on the hills, and the hills eroded at one point. All the erosion with the waste was going down into the stream. Though sheep are one example, there were also boar (wild pig), horses, and dogs. All of the waste will go in the stream. The human waste goes into the waste tank as there are no pipes going to the mainland. This tank could leak and have gone into the stream.
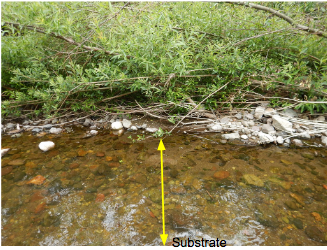
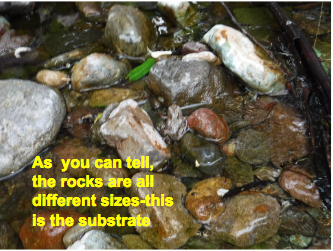
Because we are looking at all the components of a healthy ecosystem, we also conducted some substrate sampling tests on stream section #2. To measure the substrate, we used a caliper to pick up and measure every rock one foot of the way to the other side of the stream bed. By picking up the rocks every foot (size of our foot) the results are accurate because there is equal distance between each rock across the stream and the results are a bit more sparse. At the first stream, the substrate was a rocky-gravel substrate. The substrate sampling results are found below.
• A substrate is the floor of a river or creek.
| Rock # | Length | Width | Height |
|---|---|---|---|
| R1 | 5.1cm | 3.4cm | 3.1cm |
| R2 | 14cm | 10.3cm | 6.6cm |
| R3 | 40.3cm | 36.3cm | 20.5cm |
| R4 | 62.6cm | 32.7cm | 22.7cm |
| R5 | 19.9cm | 28.1cm | 22.7cm |
| R6 | 20.6cm | 16.3cm | 9.1cm |
| R7 | 46.6cm | 32.5cm | 18.5cm |
| R8 | 49.2cm | 28.6cm | 20.6cm |
| R9 | 23.5cm | 20.4cm | 12.1cm |
| R10 | 12.6cm | 7.8cm | 7.8cm |
| R11 | 5.1cm | 3cm | 1.8cm |
| R12 | 19.8cm | 12.6cm | 10.6cm |
| R13 | 24.7cm | 12.18cm | 8.07cm |
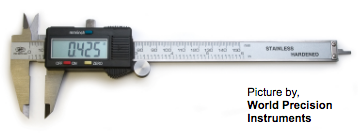
Above is a caliper. Calipers measure objects with extreme accuracy up to 150mm
The average of all our rocks from the substrate sampling is:
Length: 26.4615384615 Centimeters
Width: 18.7830769231 Centimeters
Height: 10.8823076923 Centimeters
KEY
• RED= Average-final number
As you can tell the length is the biggest average, then comes width, and smallest is height. The numbers go down.
Based on the data above, we noticed there is not a visible pattern, but the first 2 rocks, R1 and R2 seem to be slightly smaller than the other rocks after them. For example, R3 is a big jump because it went from 14 to 40 cm in length and 10.3 to 36.3 in width. This shows that the first few rocks on the edge of the water start like smaller gravel and then increase once they get deeper down. However, the rocks loosely follow this pattern as there is a diversity of sizes everywhere. By way of explanation, for the amount of data we collected there is no real pattern in the sizes of the deepest points of the stream.
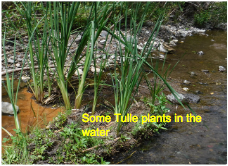
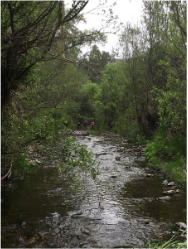
At both streams in Cañada del Puerto there was not a lot of vegetation in the water. In about 12 meters of water at the first stream, only about 5% was tule and there was no other vegetation. And in the second stream there was lots of algae in the water. Algae sucks up Dissolved Oxygen which leads to it not being very helpful at certain times because lots of animals need dissolved oxygen to survive. For example, fish! Fish need dissolved oxygen and cannot live in the water without it. That is probably the reason there are no fish in Las Cascadas and Cañada del Puerto because there is 0 ppm dissolved oxygen.
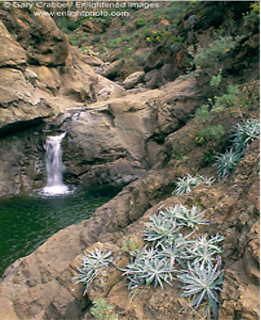
Water Hole-Las Cascadas
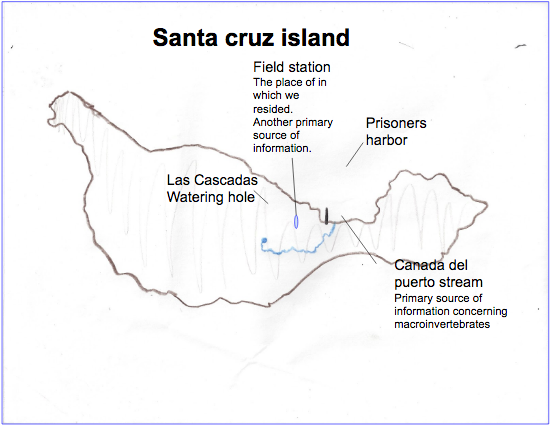
This is a map of Santa Cruz Island. It presents the destinations where we did our primary research. We docked at Prisoners Harbor on May 8th and proceeded to conduct research until the 13th.

